Problem Statement
A rectangle has one corner on the graph of y= 16 - x^2, another at the origin, a third on the positive Y-axis. and the fourth on the positive X-axis. If the area of the rectangle is a function of X, what value of X yields the largest area for the rectangle?
As you can see, our prompt is to find which rectangle within this parabola hold the biggest area.
As you can see, our prompt is to find which rectangle within this parabola hold the biggest area.
Diagram |
Maximum Area |
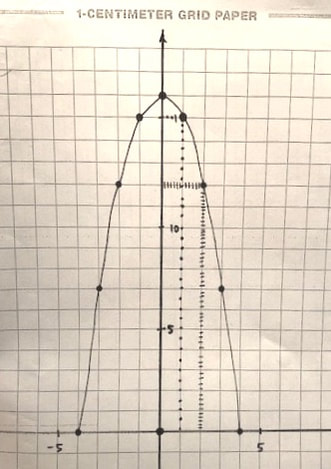
In this diagram I show the different rectangles that I could create using the mentioned points. This diagram does not show all rectangles possible, only a few rectangles at whole numbers. I also did use this same diagram throughout the whole problem. |
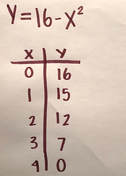
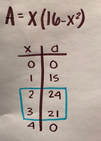
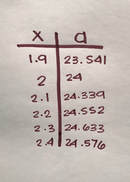
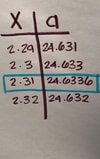
To solve for the maximum area, we used an x&y table to find the area of different rectangles. This was an important step we needed to take in order to solve the problem so it had to be done neatly. From this table, we took the points and created another table specifically for the area of each rectangle. As you can see in the second picture, the biggest area we found was 24 and it dropped to 23, when the x changed to 3. From there, we got into more specific numbers, decimals. I checked for the number right below 2, 1.9 to see if there was an increase or decrease in the area. Once I saw that it went down, I skipped to a number above 2, 2.1. Since I saw that the area for this number was bigger than the area for 2, I kept going. I tried 2.2, 2.3, which all had bigger areas. I stopped at 2.4 because this is where the area dropped. I repeated this same process in another table to find the answer to the nearest hundredths. The equation we used to find the area was a=x(16-x^2) which is just a variation of a=xy or a=lw. The answer was x=2.31
|
Maximum Perimeter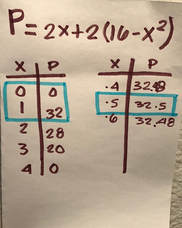
In order to solve for the maximum perimeter, after we plotted the graph, we used the equation p=2(x+(16-x^2)) or p=2x+2(16-x^2). This made sense to me since the perimeter for a rectangle is just p=2(l+w) or p=2(x+y), so we just elaborated on what y is. For this problem went through the same process that we used to solve for the area, We first found the perimeter of a few whole numbers then got more detailed with decimals. I found the highest whole number to be in between 0 and 1. I went into choosing decimals and saw the biggest perimeter belonged to .5.
|
Final AssesmentIn order to prepare for our group quiz, our table worked independently but also worked together to make sure each of us really understood each part to solve the problem. We took time to try to figure out our questions but did also rely on our group members to ask for help when we needed it. Each of us was able to bring something positive to the group.
During the quiz, I believe we did a pretty good job. All of us worked together and divided up the work evenly. We made sure we understood each question but also kept track of how much time we were spending. I believe we all understood this problem well enough. I received a 30/30 on my individual test and a 75/80 on our group quiz. After seeing what we missed, we were all able to identify the issue. This group test felt a little easier to me than the past ones. I think everyone in my table really took the time to understand each step of it which made it so much easier. Overall, it was a fun problem to solve. |
Evaluation
If I were to give myself a grade on this unit, I'd give myself an A. I was able to turn in all of my work and be confident in it, This problem was mostly a problem of strategy. I didn't think it was too hard but it did require some thinking which we were all able to solve in the end. I really enjoyed making the tables because it was easy for me to see a visual of the numbers we were putting together. One thing I struggled with was answering my own questions of "Why?", this was a fun process though. For the most part I was able to answer my own questions and if I really could't my group would always be there to help me process my thinking.
